Editing Dashboards
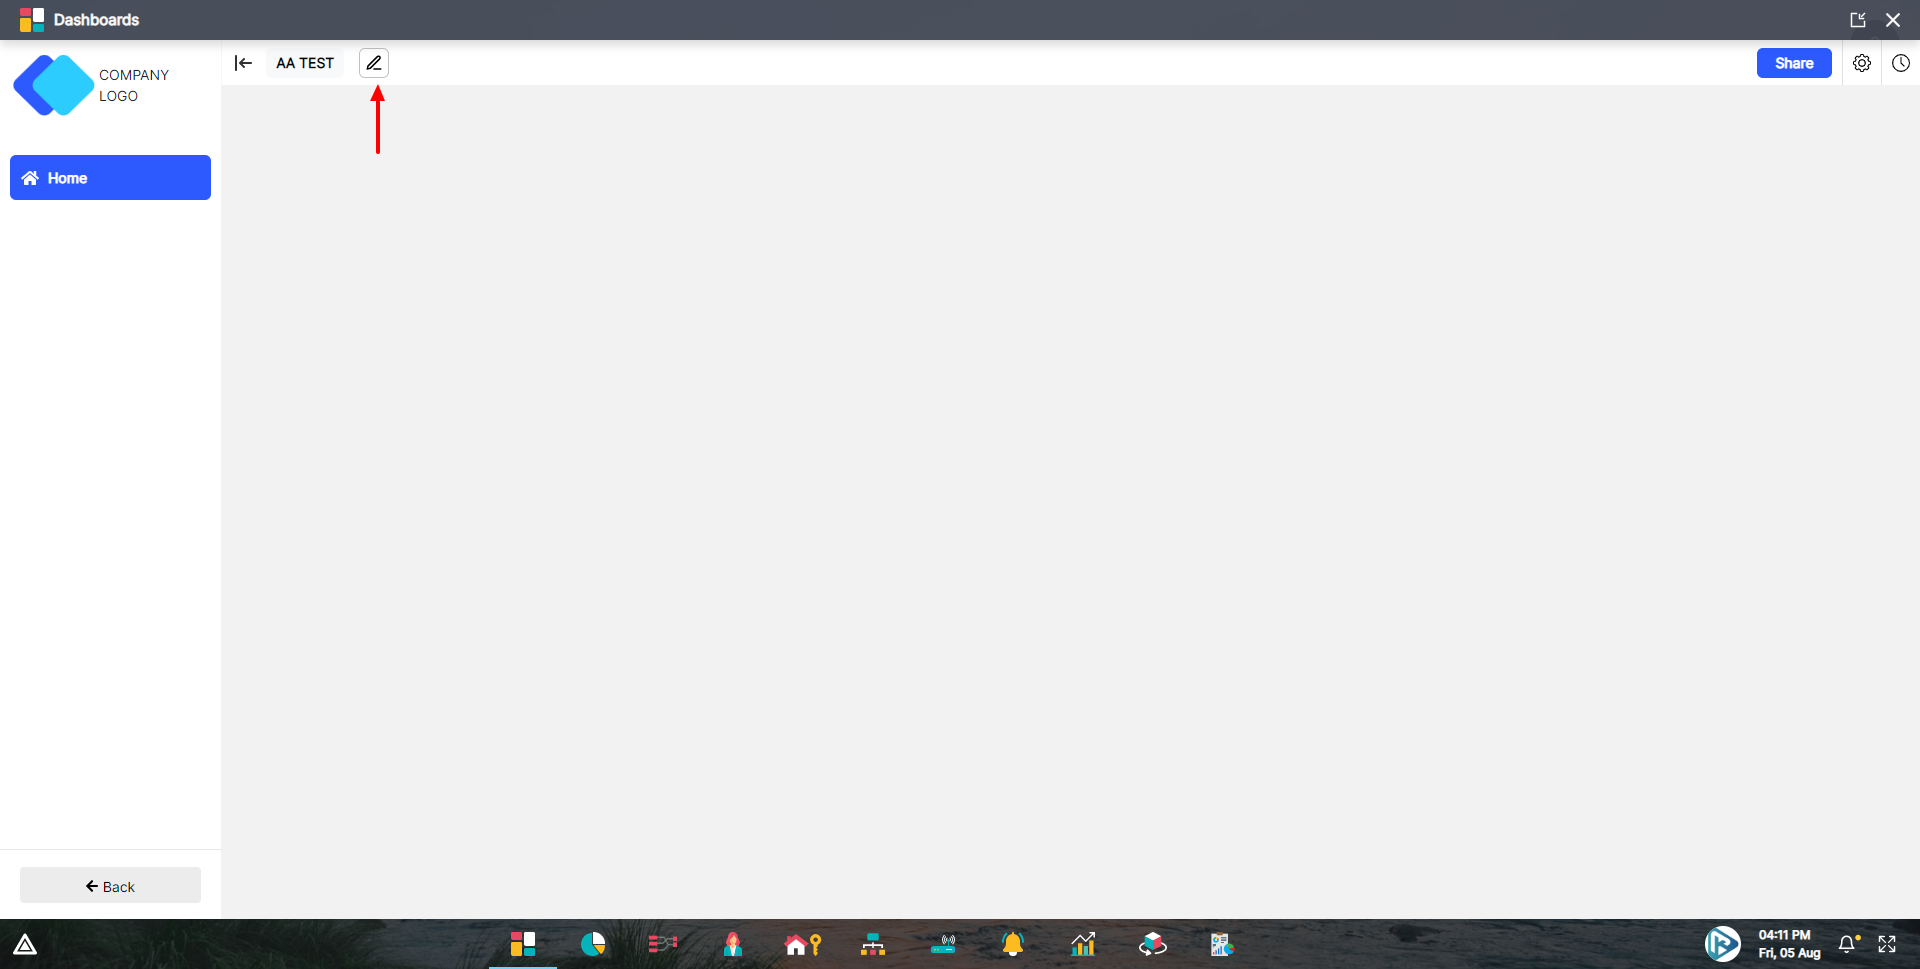
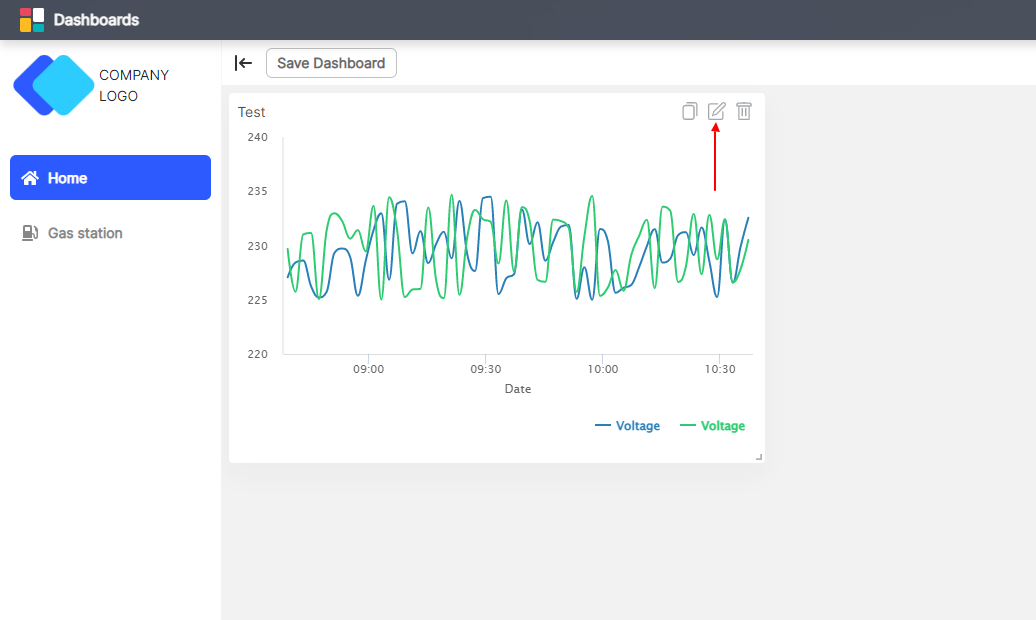
To switch the dashboard in edit mode, just click on the pencil icon present on the dashboard header.
 In edit mode dashboard will look something like below.
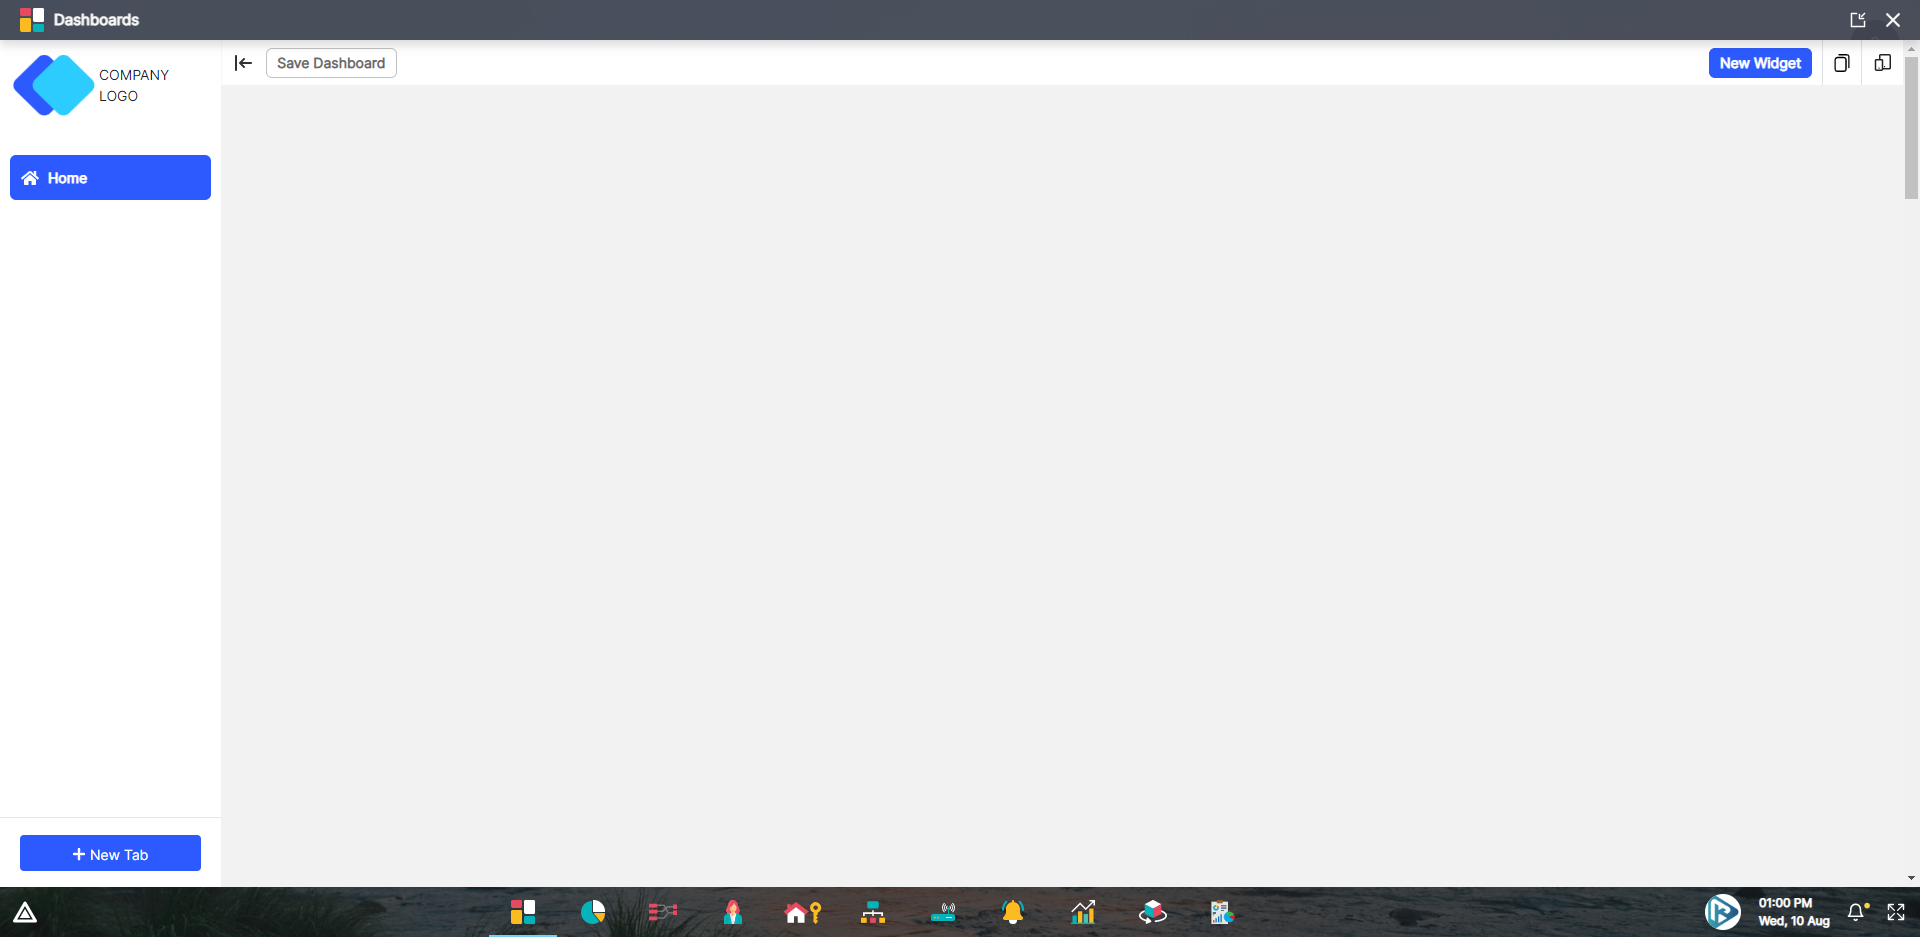 In edit mode, dashboard header options also changes as shown above.
User will not be able to switch to other dashboards in edit mode.
In edit mode, dashboard header options also changes as shown above.
User will not be able to switch to other dashboards in edit mode.
In edit mode, user can perform three actions on dashboard:
- Add New Widget
- Update a widget
- Delete a widget
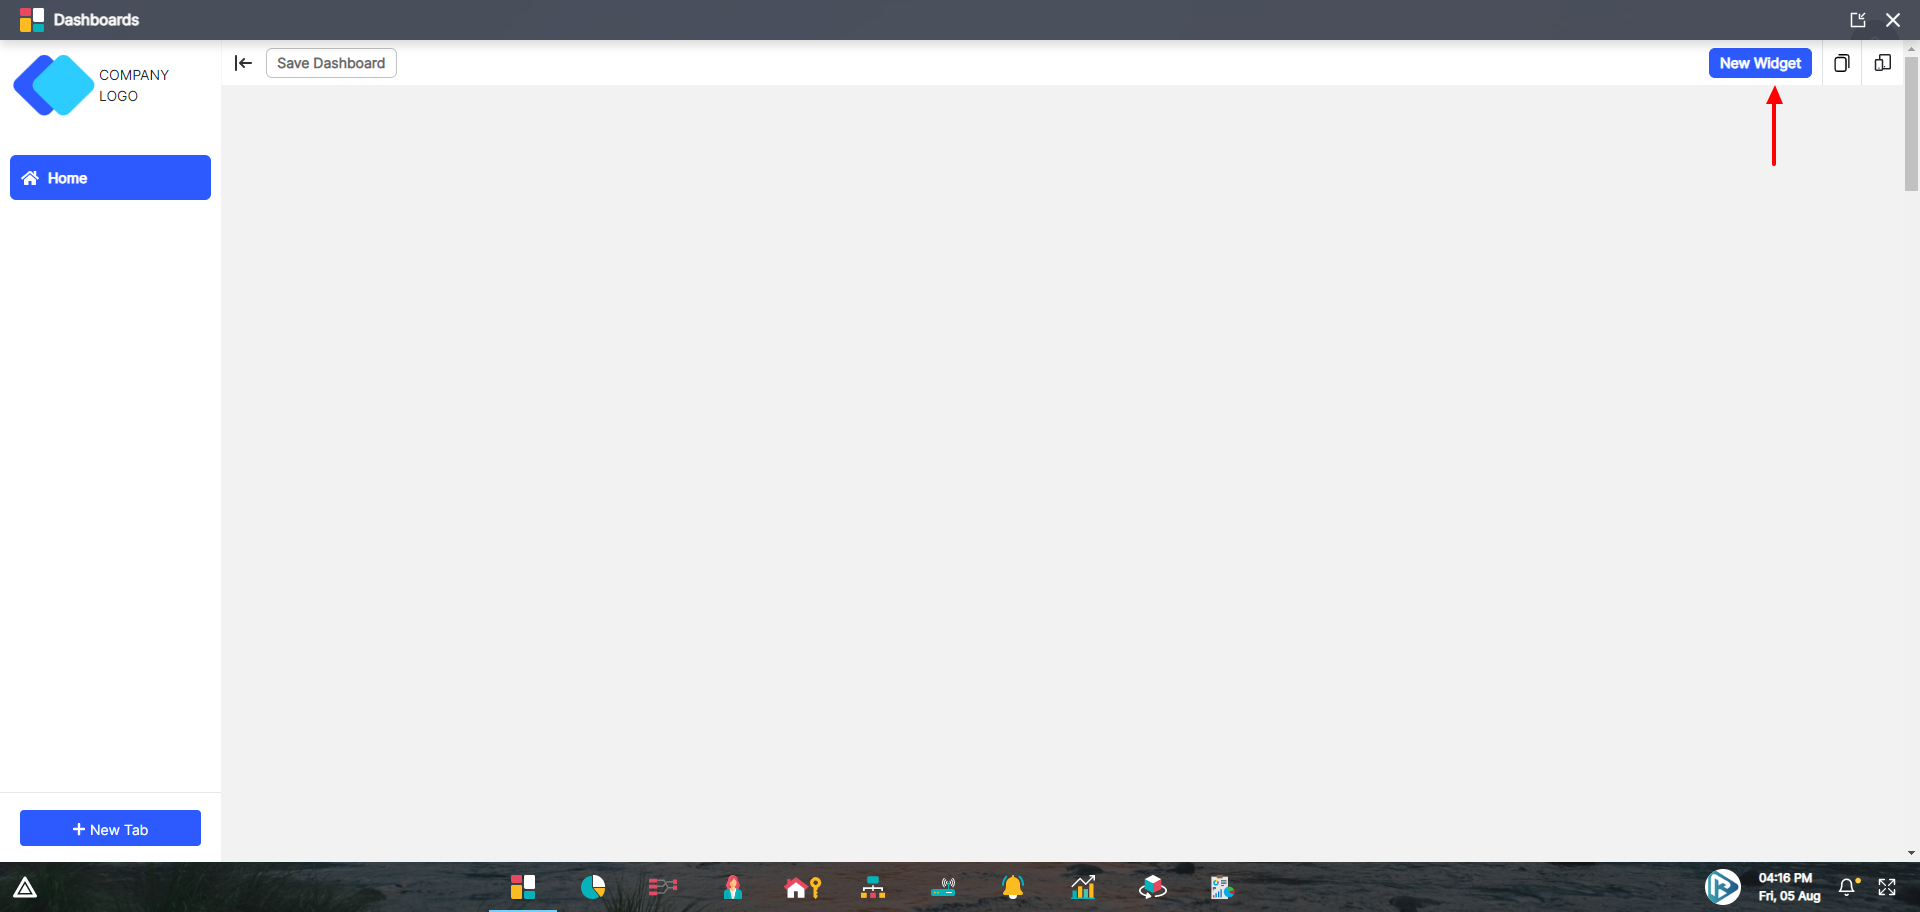
Add New widget
To add a widget, user can click on the New widget option present at the right section of the dashboard header.
 After clicking on the new widget action, right sidebar will be opened as shown below.
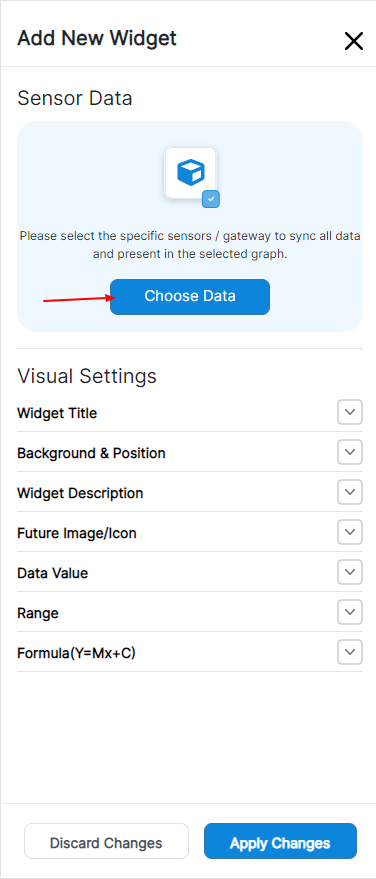
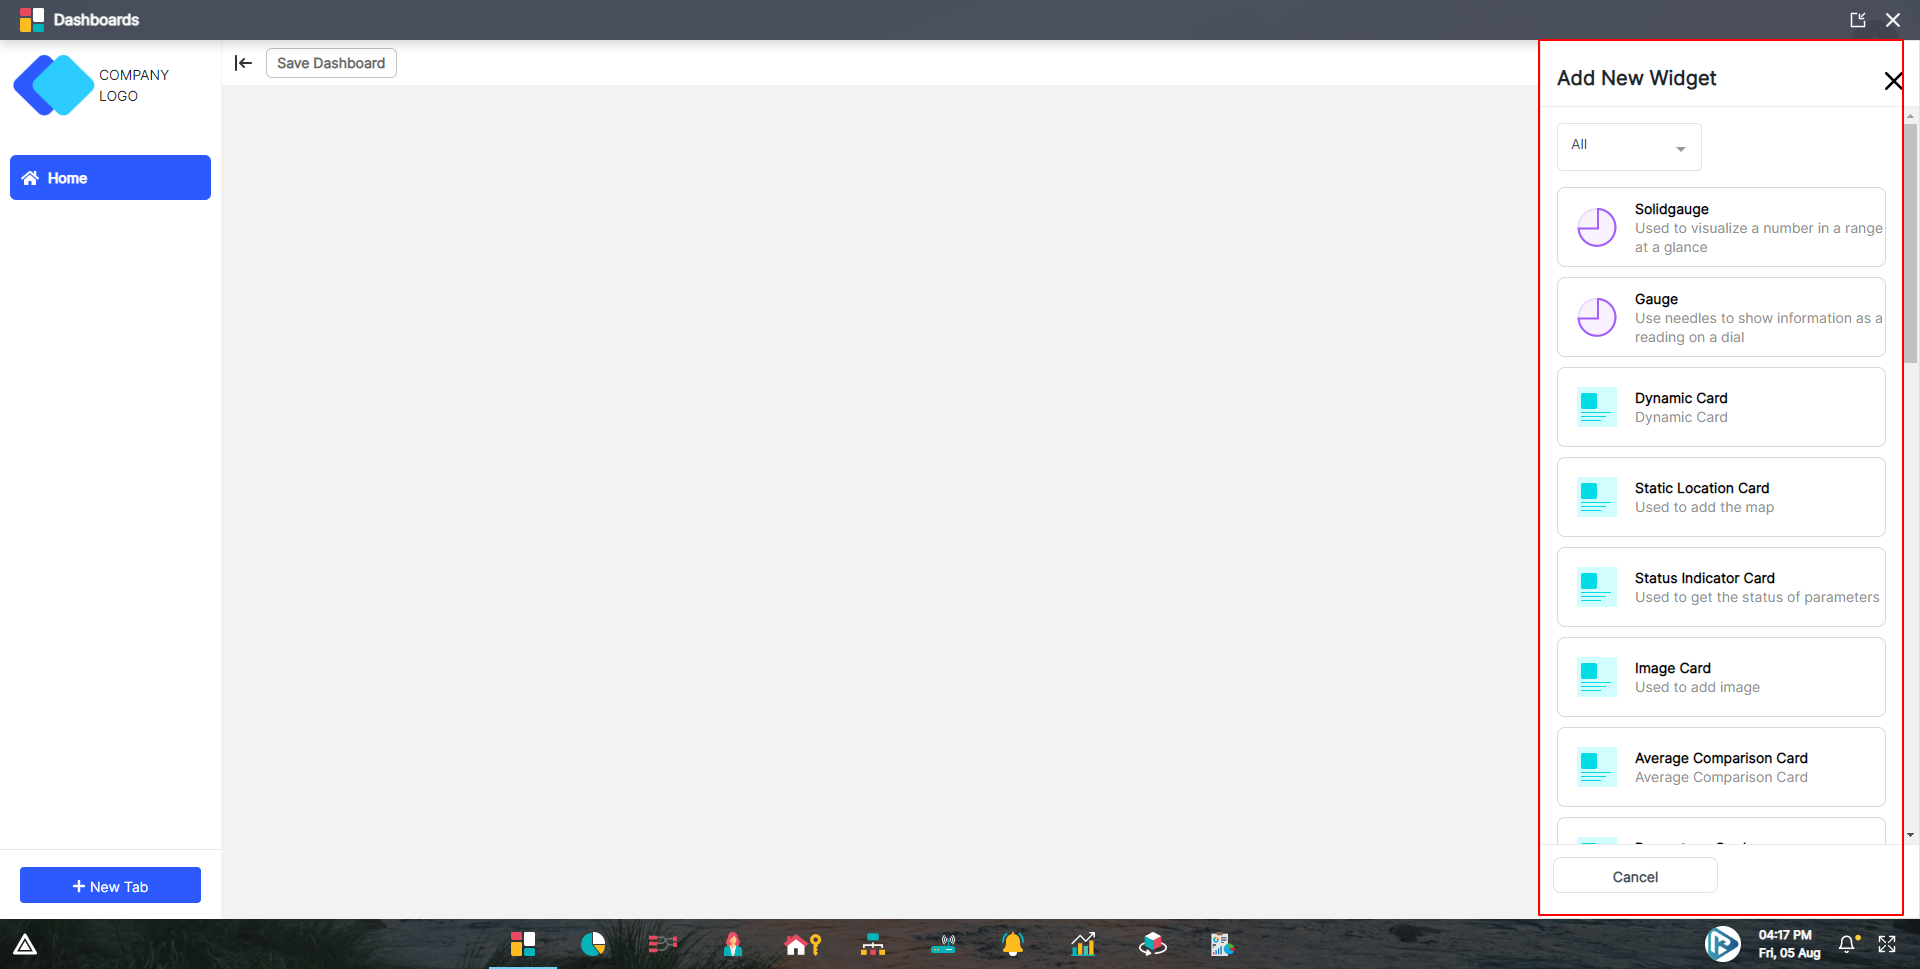 As you can see Add New Widget consists of 3 steps:
-
Widget: Choosing a widget
User can choose a widget from many options and we have categorized the widgets in 4 different ways.-
Timeseries: These type of widgets are mainly used to plot historical and realtime data.

-
Gauge: These type of widgets should be used to display realtime data.

-
Cards: Card widgets are mainly used to create cards.

-
Consumption

-
-
Data: Connecting sensor parameters to above widget. After selecting a widget, user can connect different sensor parameters to the widget from the Organisation Heirarchy tree.
This step will not be present in case of Static and Image cards, since these cards will not display any data. If you want to display sensor data in form of card, we have Dynamic card for that purpose.
Once you select the widget, below screen will be visible. Click on Choose Data button

Then select the desired sensors

-
Settings: Configure widget visual and data settings.
Once the user is done with selecting sensor parameters, they can configure few settings for better visual display of widgets.
Visual settings are mainly used to add title, background color and for other visual settings of a widget.


Let’s take an example to create a new widget step by step.
As we discussed first step is to choose a widget, we will select a Line Timeseries and then click next.

After selecting a widget user can connect different sensor parameters to a widget, so let’s suppose we want to compare between the power consumption in two Apartments, Apt Red 11 and Apt Red 12, so we will select the voltage parameter of these two asset energy meter sensors and then click next.

Now we are done with connecting data to our widgets, we will add visual and data settings.
As shown below you can see we have different settings available to configure, for now we will just set the title, subtitle, x axis label and y axis label of the timeseries widget.
Set Title

Title Text Formatting

Set Background Color

In case of timeseries, by default X Axis label will be Date as shown below, but user can change it.

Set Y Axis label

Add Range (Optional)
If we need colored bands on our charts then this option is usefull, user can plot multiple band by adding multiple ranges.
User can change the range from, and range to and also change the color of the range band.

Range Error
If user accidently add to value lower then from value this kind of error will be shown to the user
Range To value is always be greather then range from value, Once user correct the range the error will be disappear.

In the legend settings, we will set the color and name of two different series we have selected as shown below.

As you can see, for Apt red 11 we have set blue shade color and for Apt red 12 we have set green color.
Once we are done with the settings, we can click on apply button and after that new widget will be added to the dasbhoard.

Power consumption widget which we have added now will have some default size, if user want to expand or collpase the size of the widget, it can be done by expanding or collapsing the icon present at the bottom right corner of the widget as shown below.

On expanding it will be adjusted to the size user want, I have expanded the widget to take the full width and height as shown below.

Once user is done with adding widgets, then user can save these changes by clicking on the Save button present at the dashboard header.

After saving the dashboard, it will be automatically switched to view mode.

Note
On saving a widget, it will be automatically added to the bottom of the other widgets as shown above in the selected tab.
If you want a widget to be added in other tab, then first user has to switch to other tab and then user can add new widget in that tab.
Update a widget
To update an existing widget, first user has to switch the dashboard in edit mode.
Once the dashboard is in edit mode, existing widget can be updtated by clicking on the pencil icon present at the top right corner of the widget.
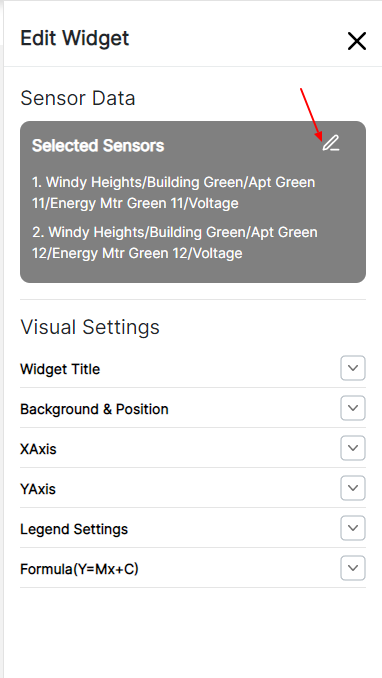
To Edit sensor data, Click on edit icon shown in below image
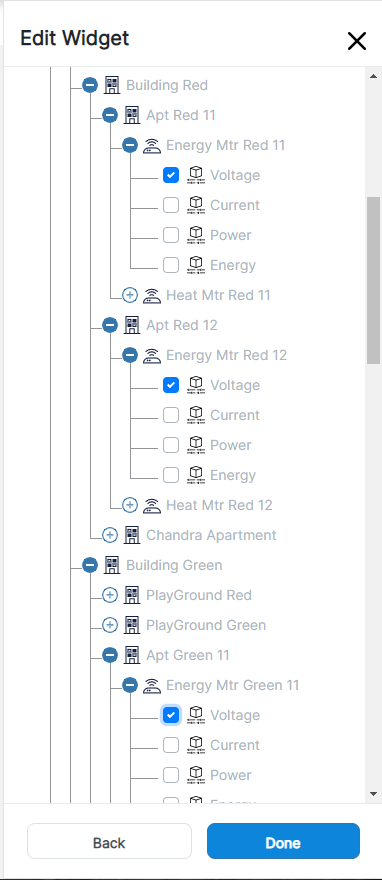
Let’s add one more sensor parameter to the widget, here we are adding voltage of Apt red 11 as shown below.
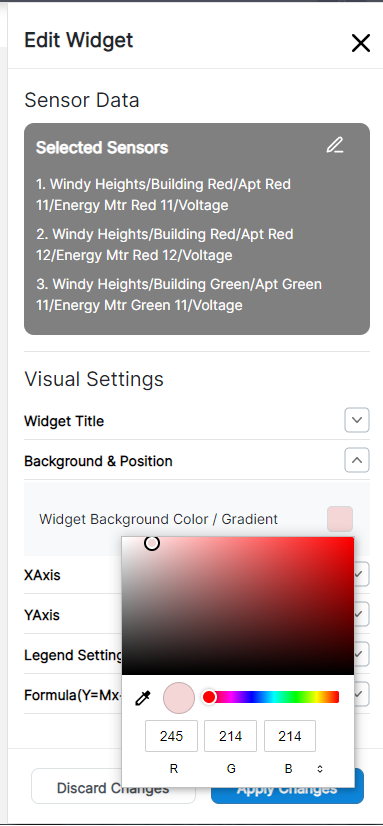
Also, let’s update the backround color of the widget as shown below
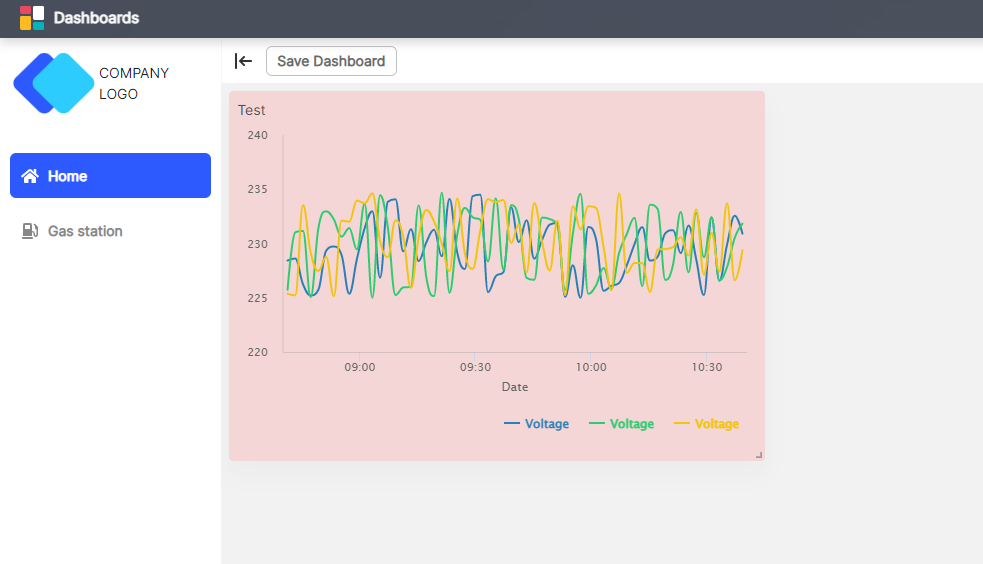
On Saving widget will updated as per the settings we have done as below
Note
User cannot update the type of an existing widget. If user wants to change this, then first delete widget and then create new widget of different type.
Delete a widget
User can remove an existing widget on the dashboard by clicking on the dustbin icon present at the top right corner of the widget.

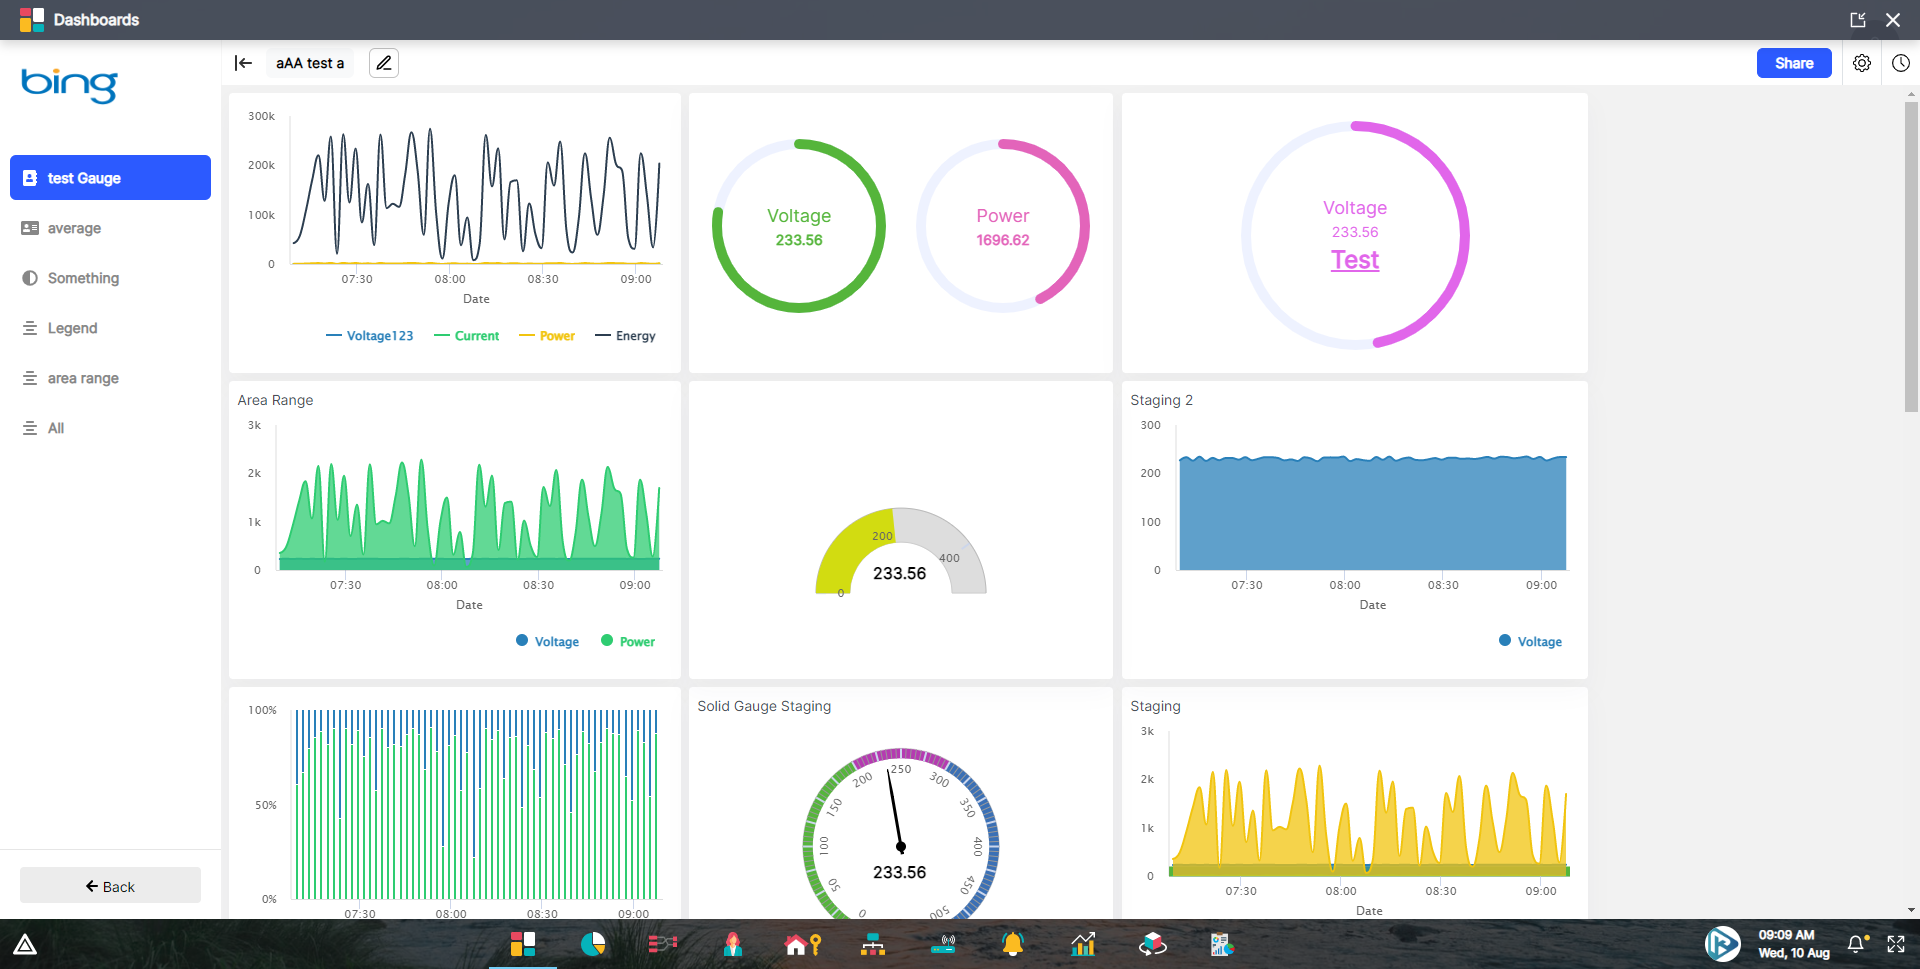
User can add more widgets as per the requirements. Below are some of the examples of dashboard.

Duplicate a widget
We can duplicate widget in same dasbhoard panels as well as in different dashboard’s panels also.
-
To duplicate widget, First switch the dashboard in edit mode, just click on the pencil icon present on the dashboard header.

-
Once the dashboard switched into the eidting mode, when user hover mouse point on the widget the three icons will be shown to user
Click on the first copy/duplicate icon

-
The Duplicate widget modal will be appear on the screen
Select the targated dashboard, panel (and subpanel) and click on save, widget will be duplicated on the targetd place.


